2021 / Latin America / UX Vitals
Mapping the state of UX in Latam with quantitative data
My role
Independent
My contribution
Lean UX
Quantitative research
Data visualization
Visual design
Overview
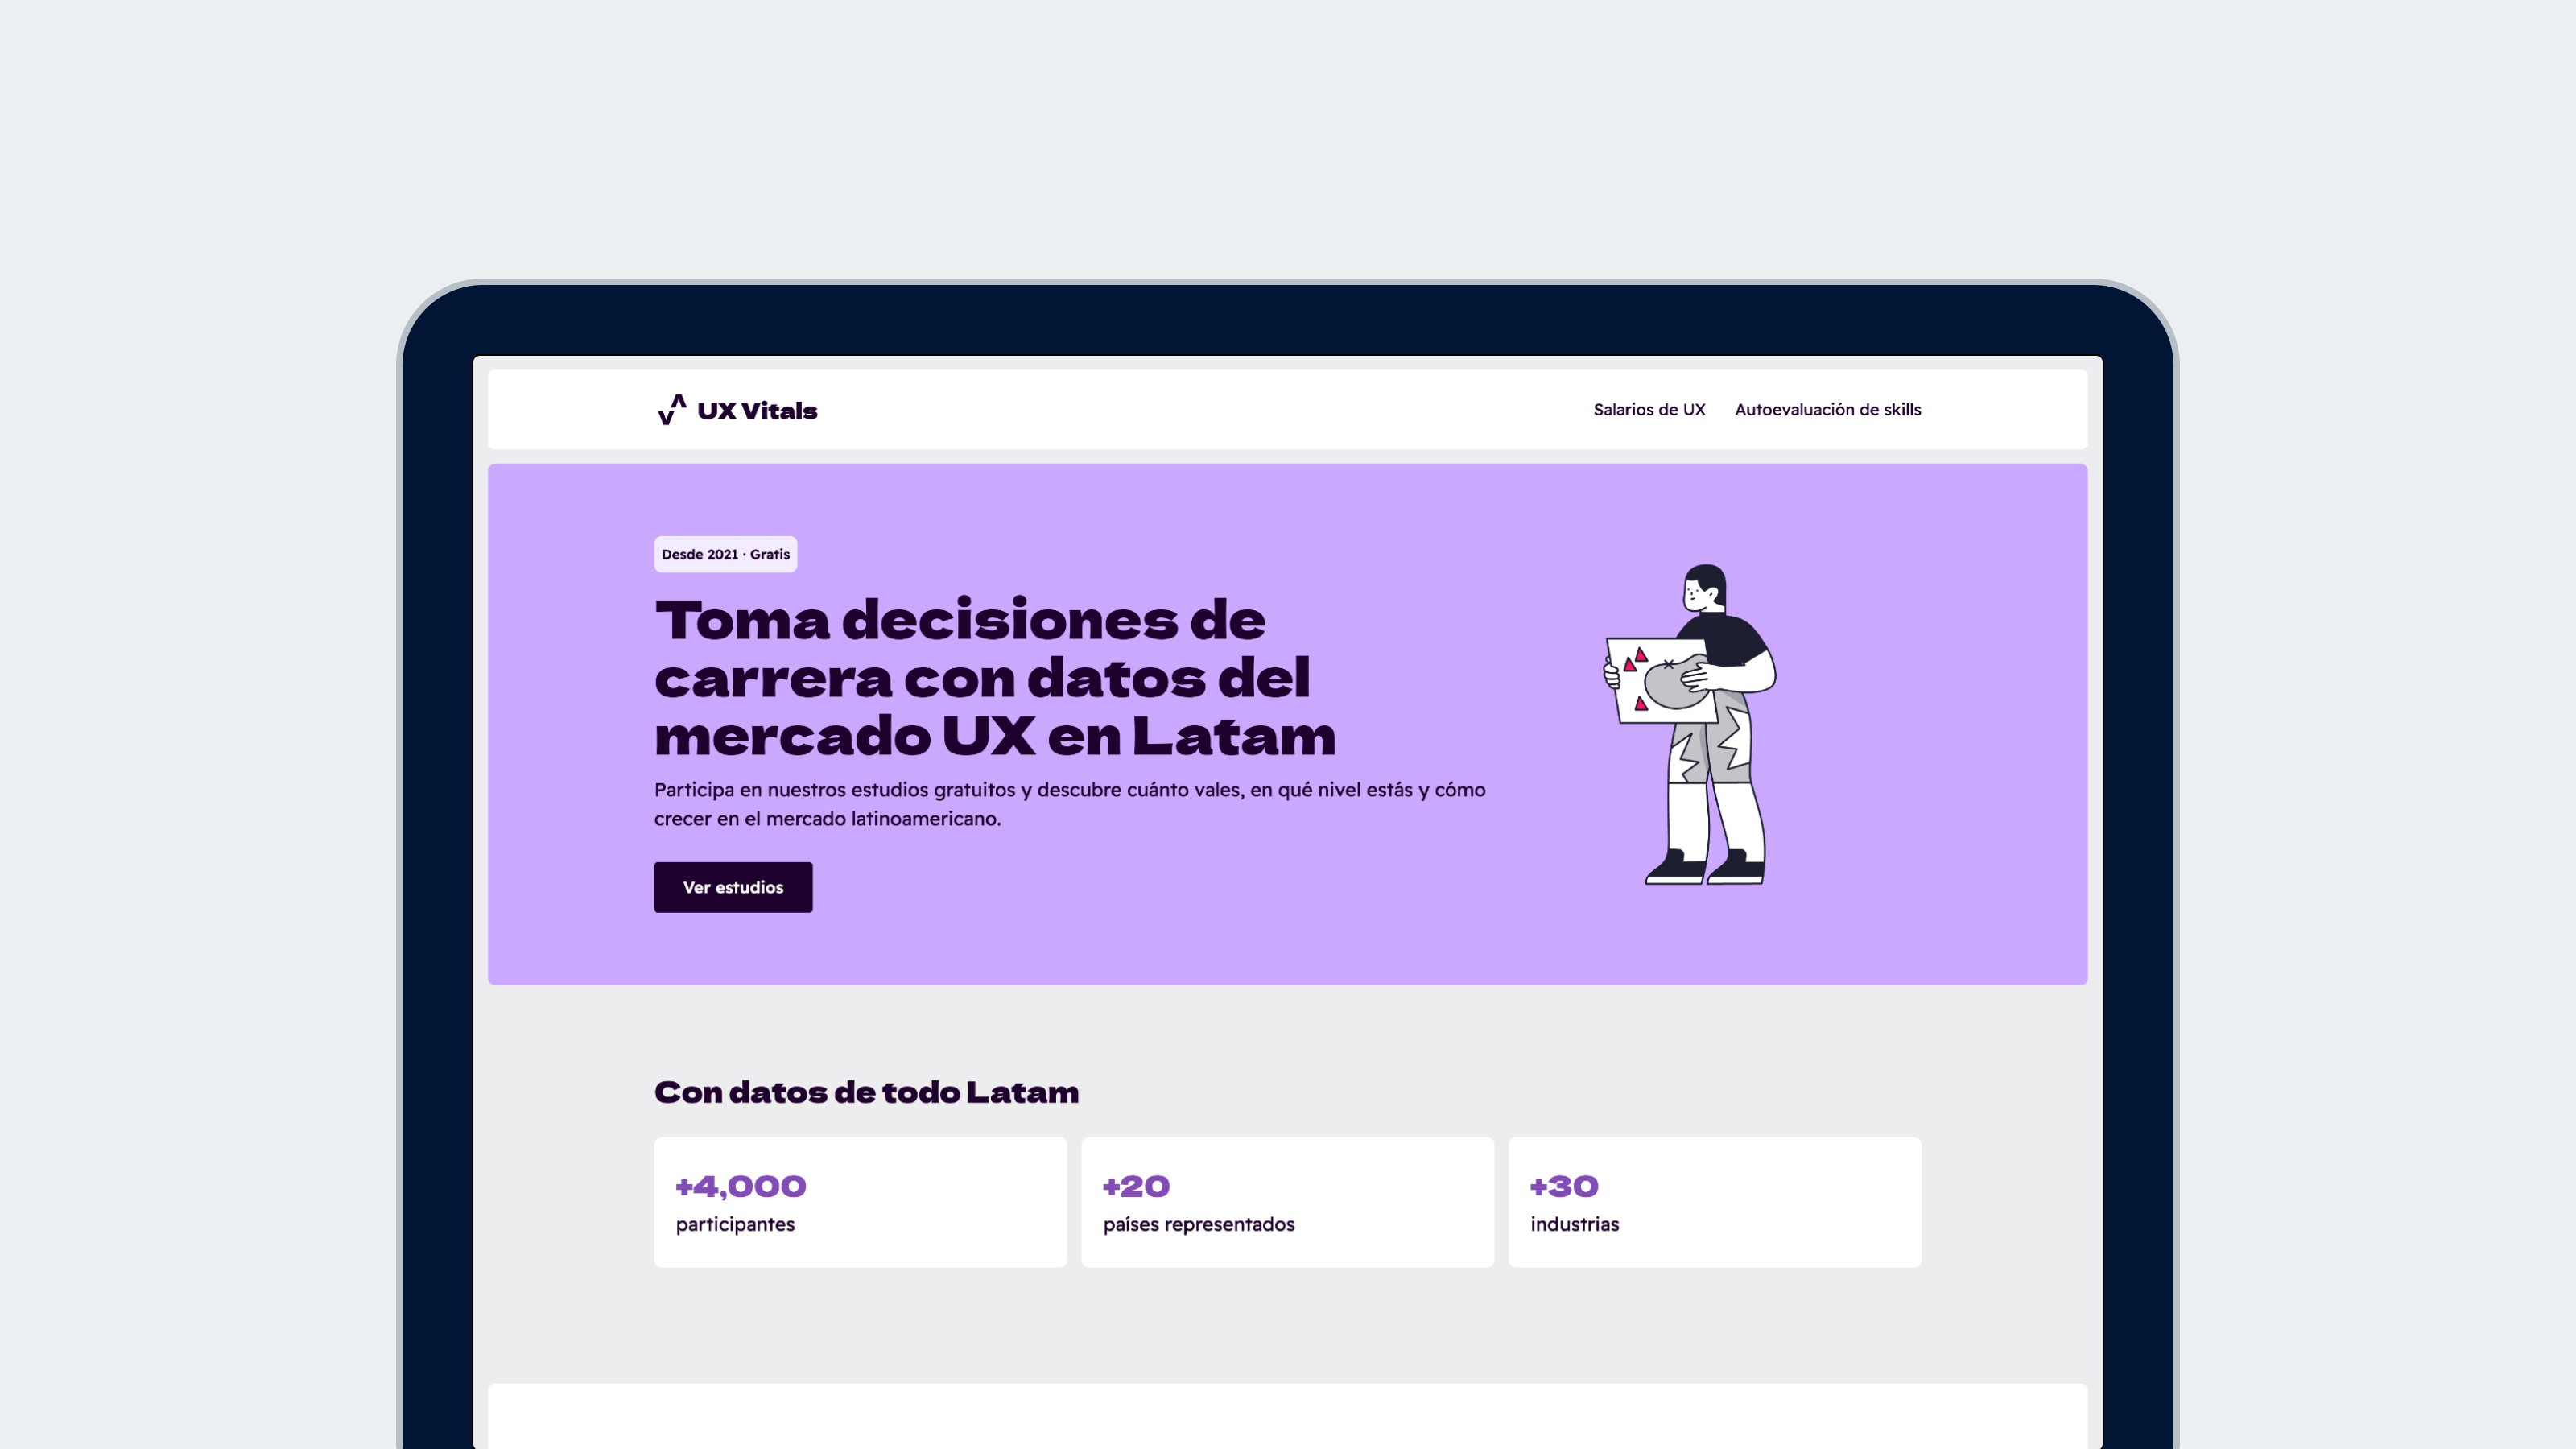
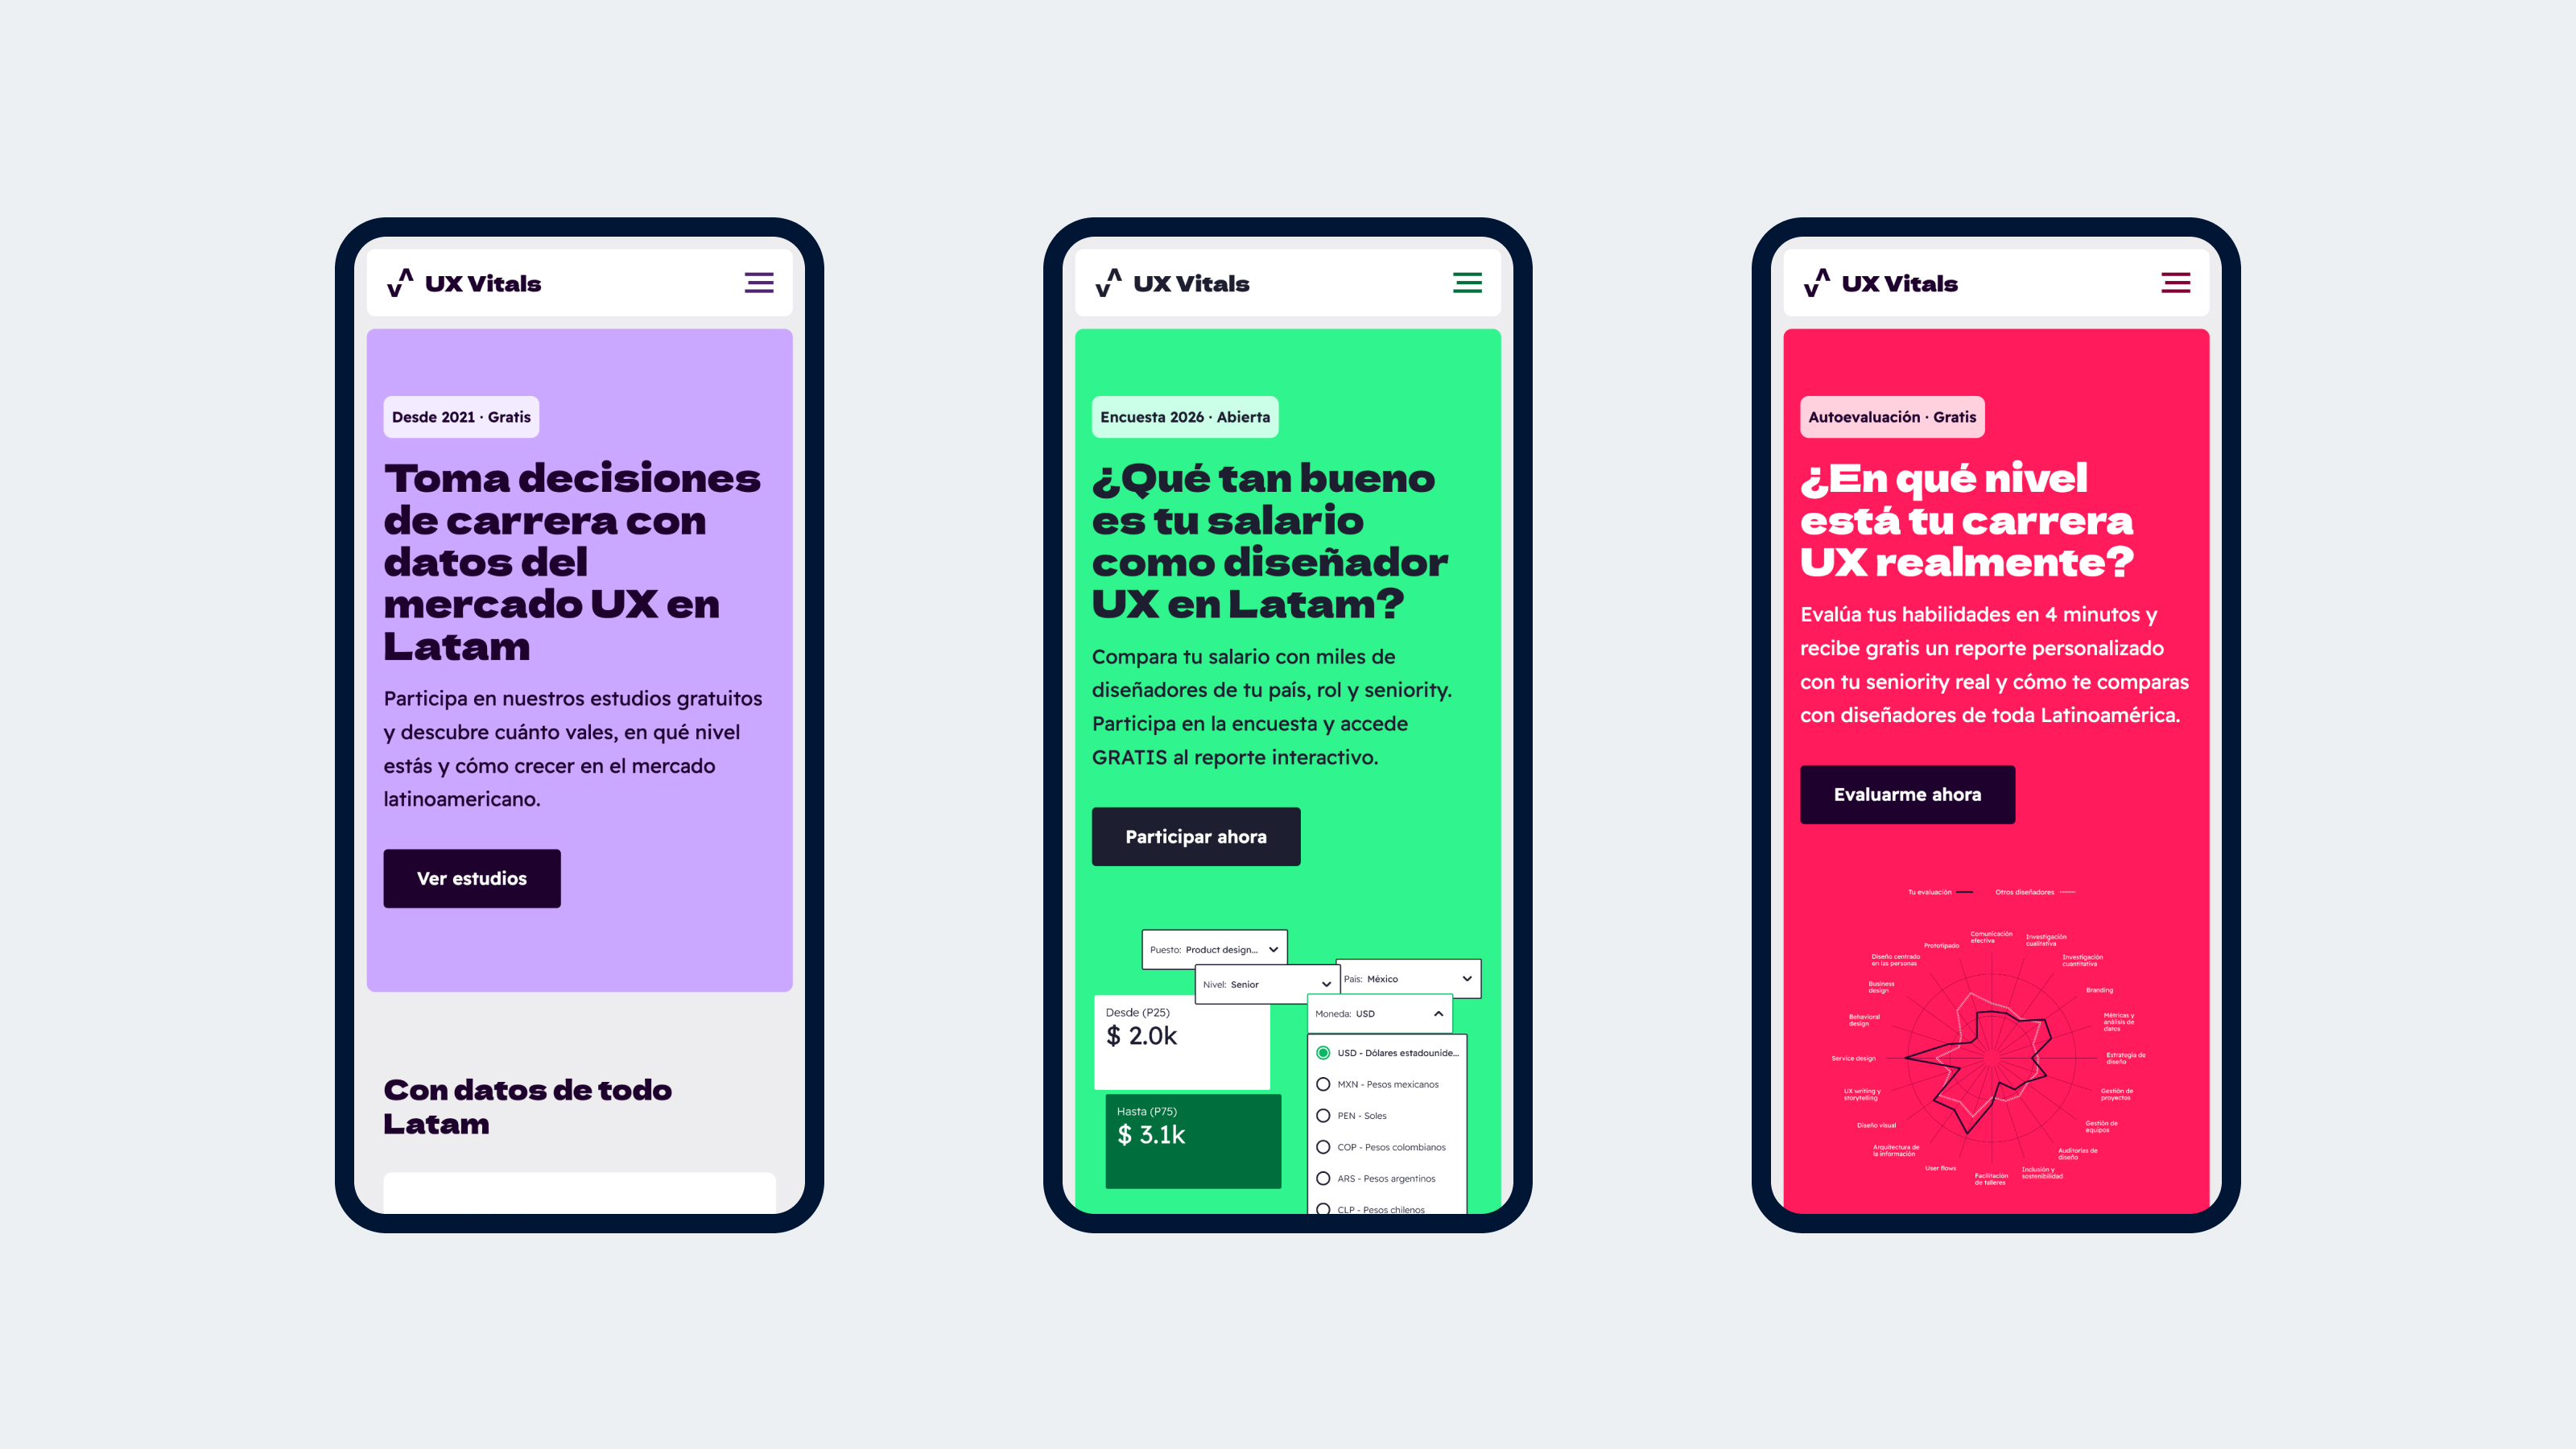
How is UX design evolving in Latin America? To answer that question I created UX Vitals, a personal project that gathers data on salaries, technical skills and UX maturity in organizations across the region.
Since launching in 2021, the study has collected +4,000 responses across +20 countries.
Over four years, this project has evolved to integrate automation, data visualization and an information architecture designed to make the data understandable and actionable.
Experimentation
A personal drive
Latin America lacks public, up-to-date information on UX design practice.
To address that, I launched a personal project of quantitative studies focused on three key areas:
Salaries and job status
Technical skill development
UX maturity of organizations
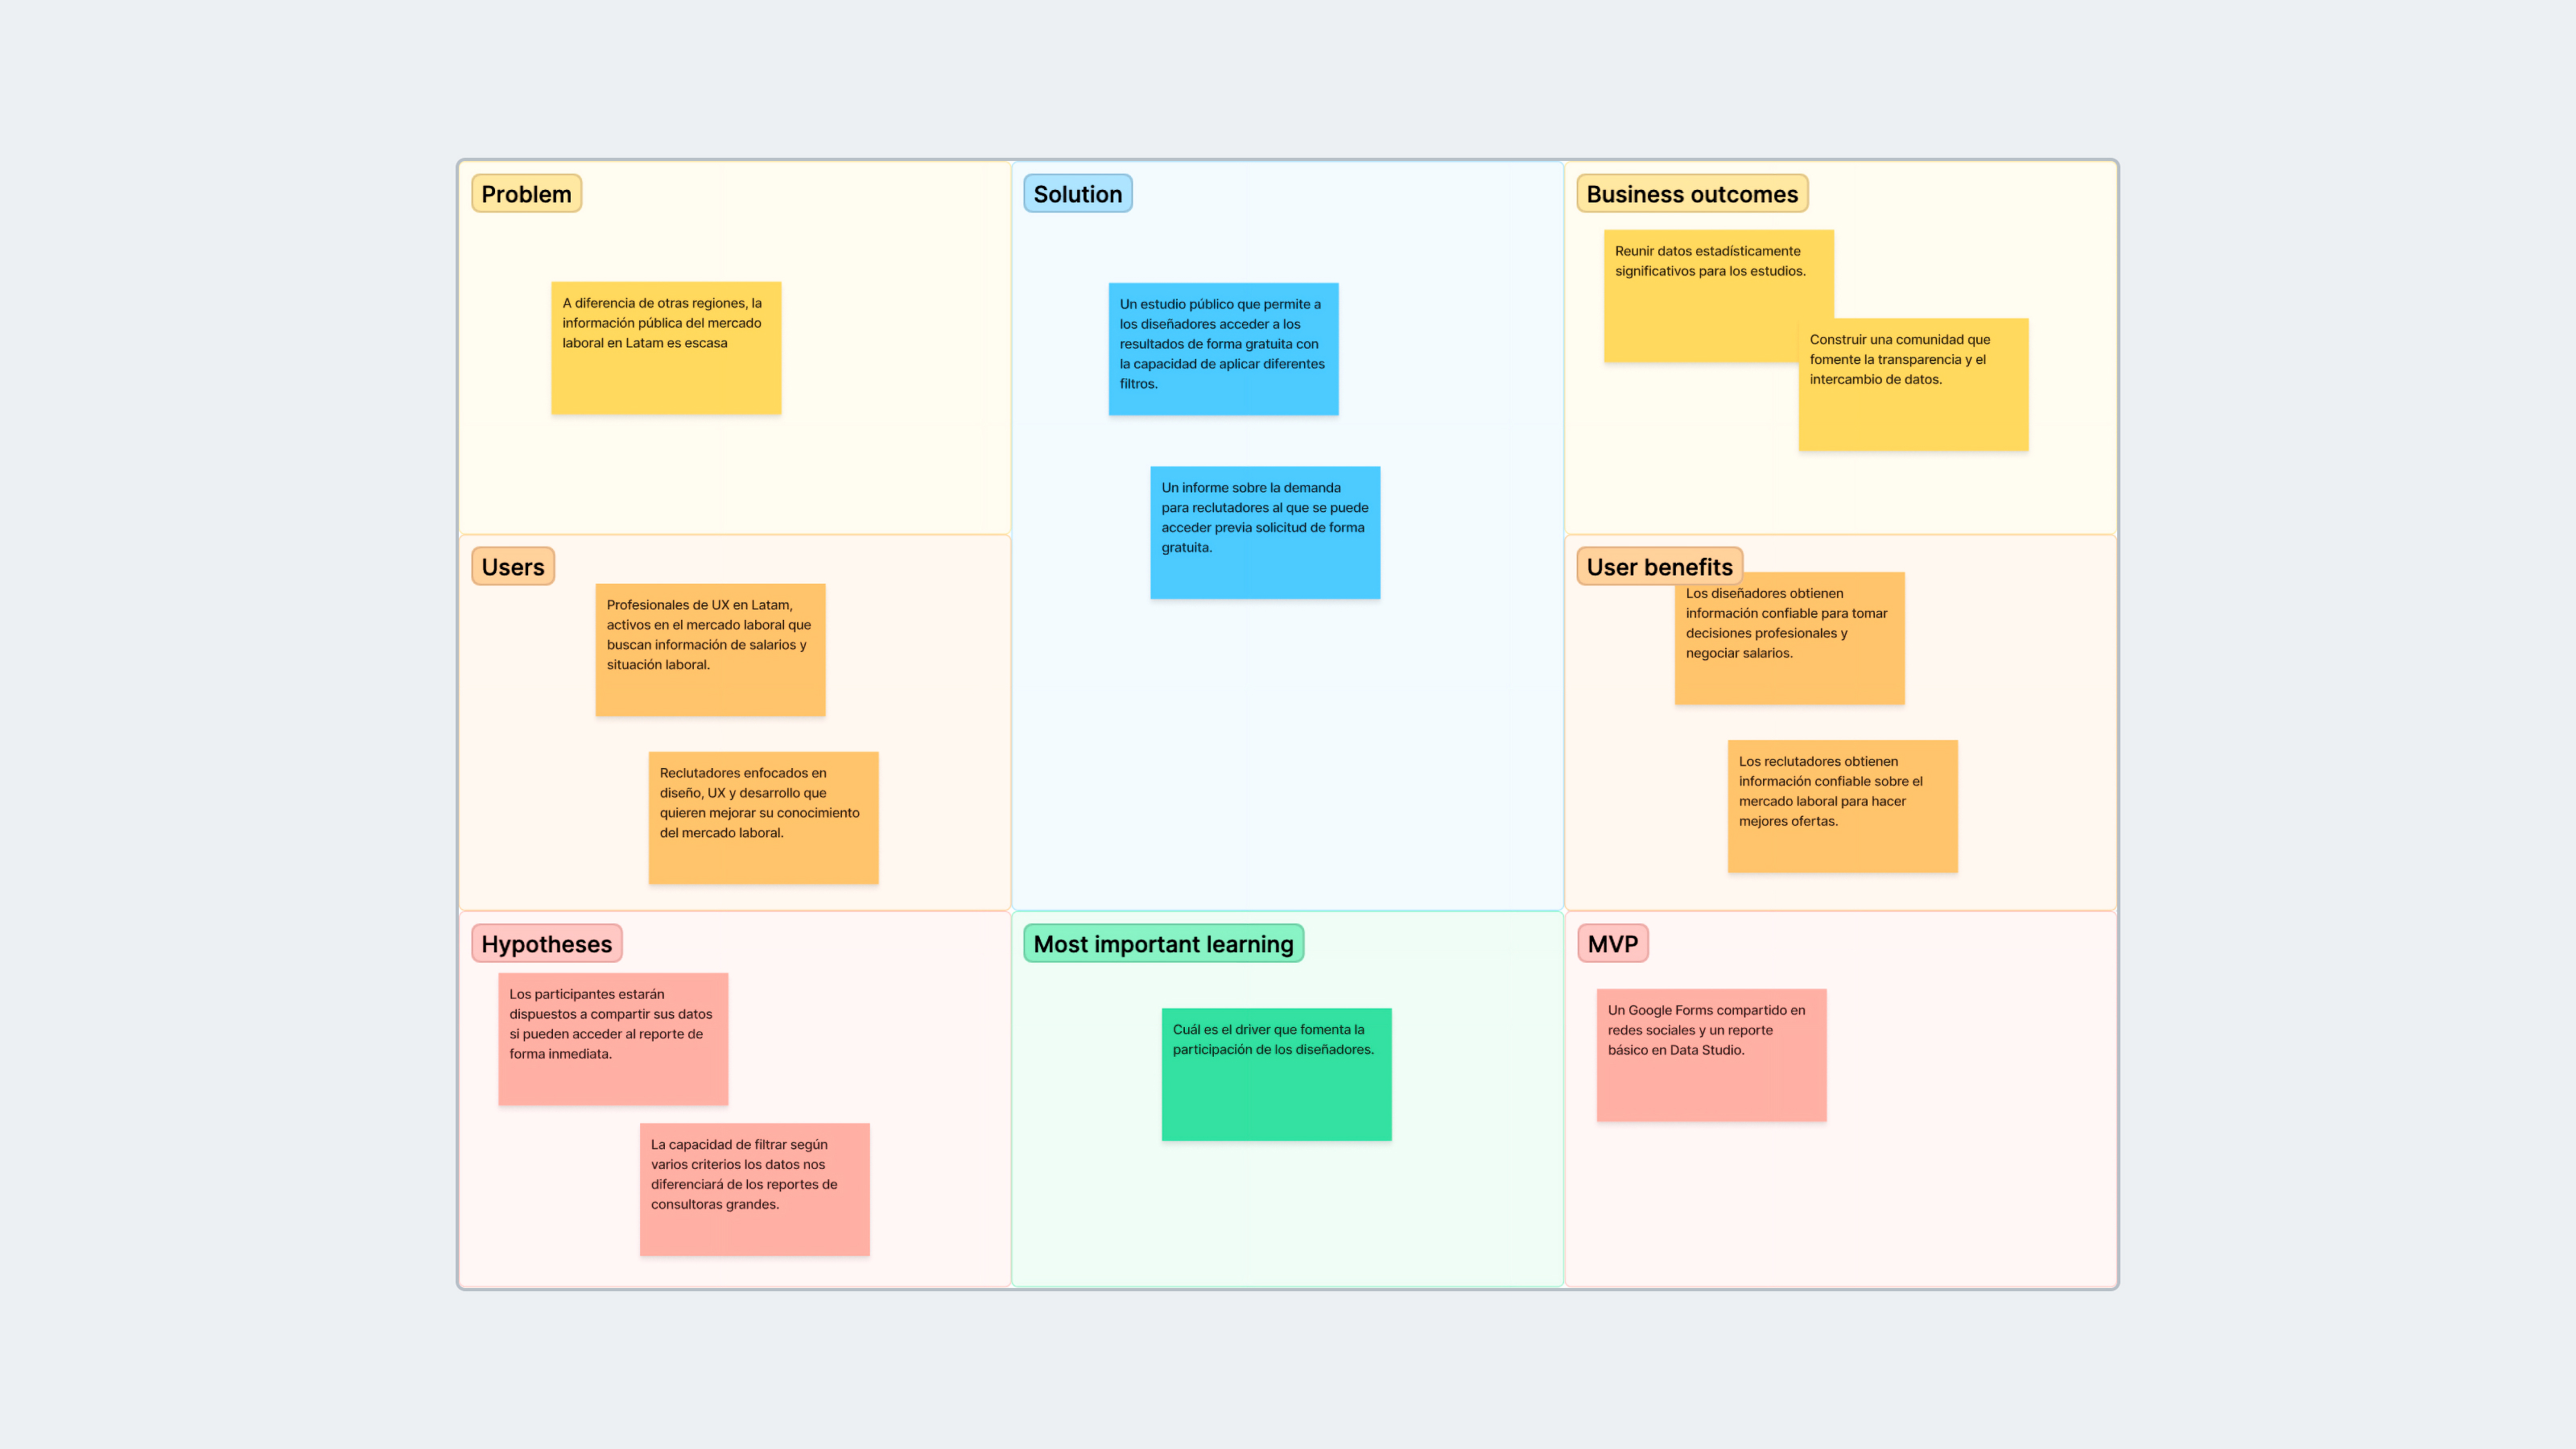
I decided to approach this project through strategic design, with a lean mindset focused on the community’s real needs.
A Lean UX experiment
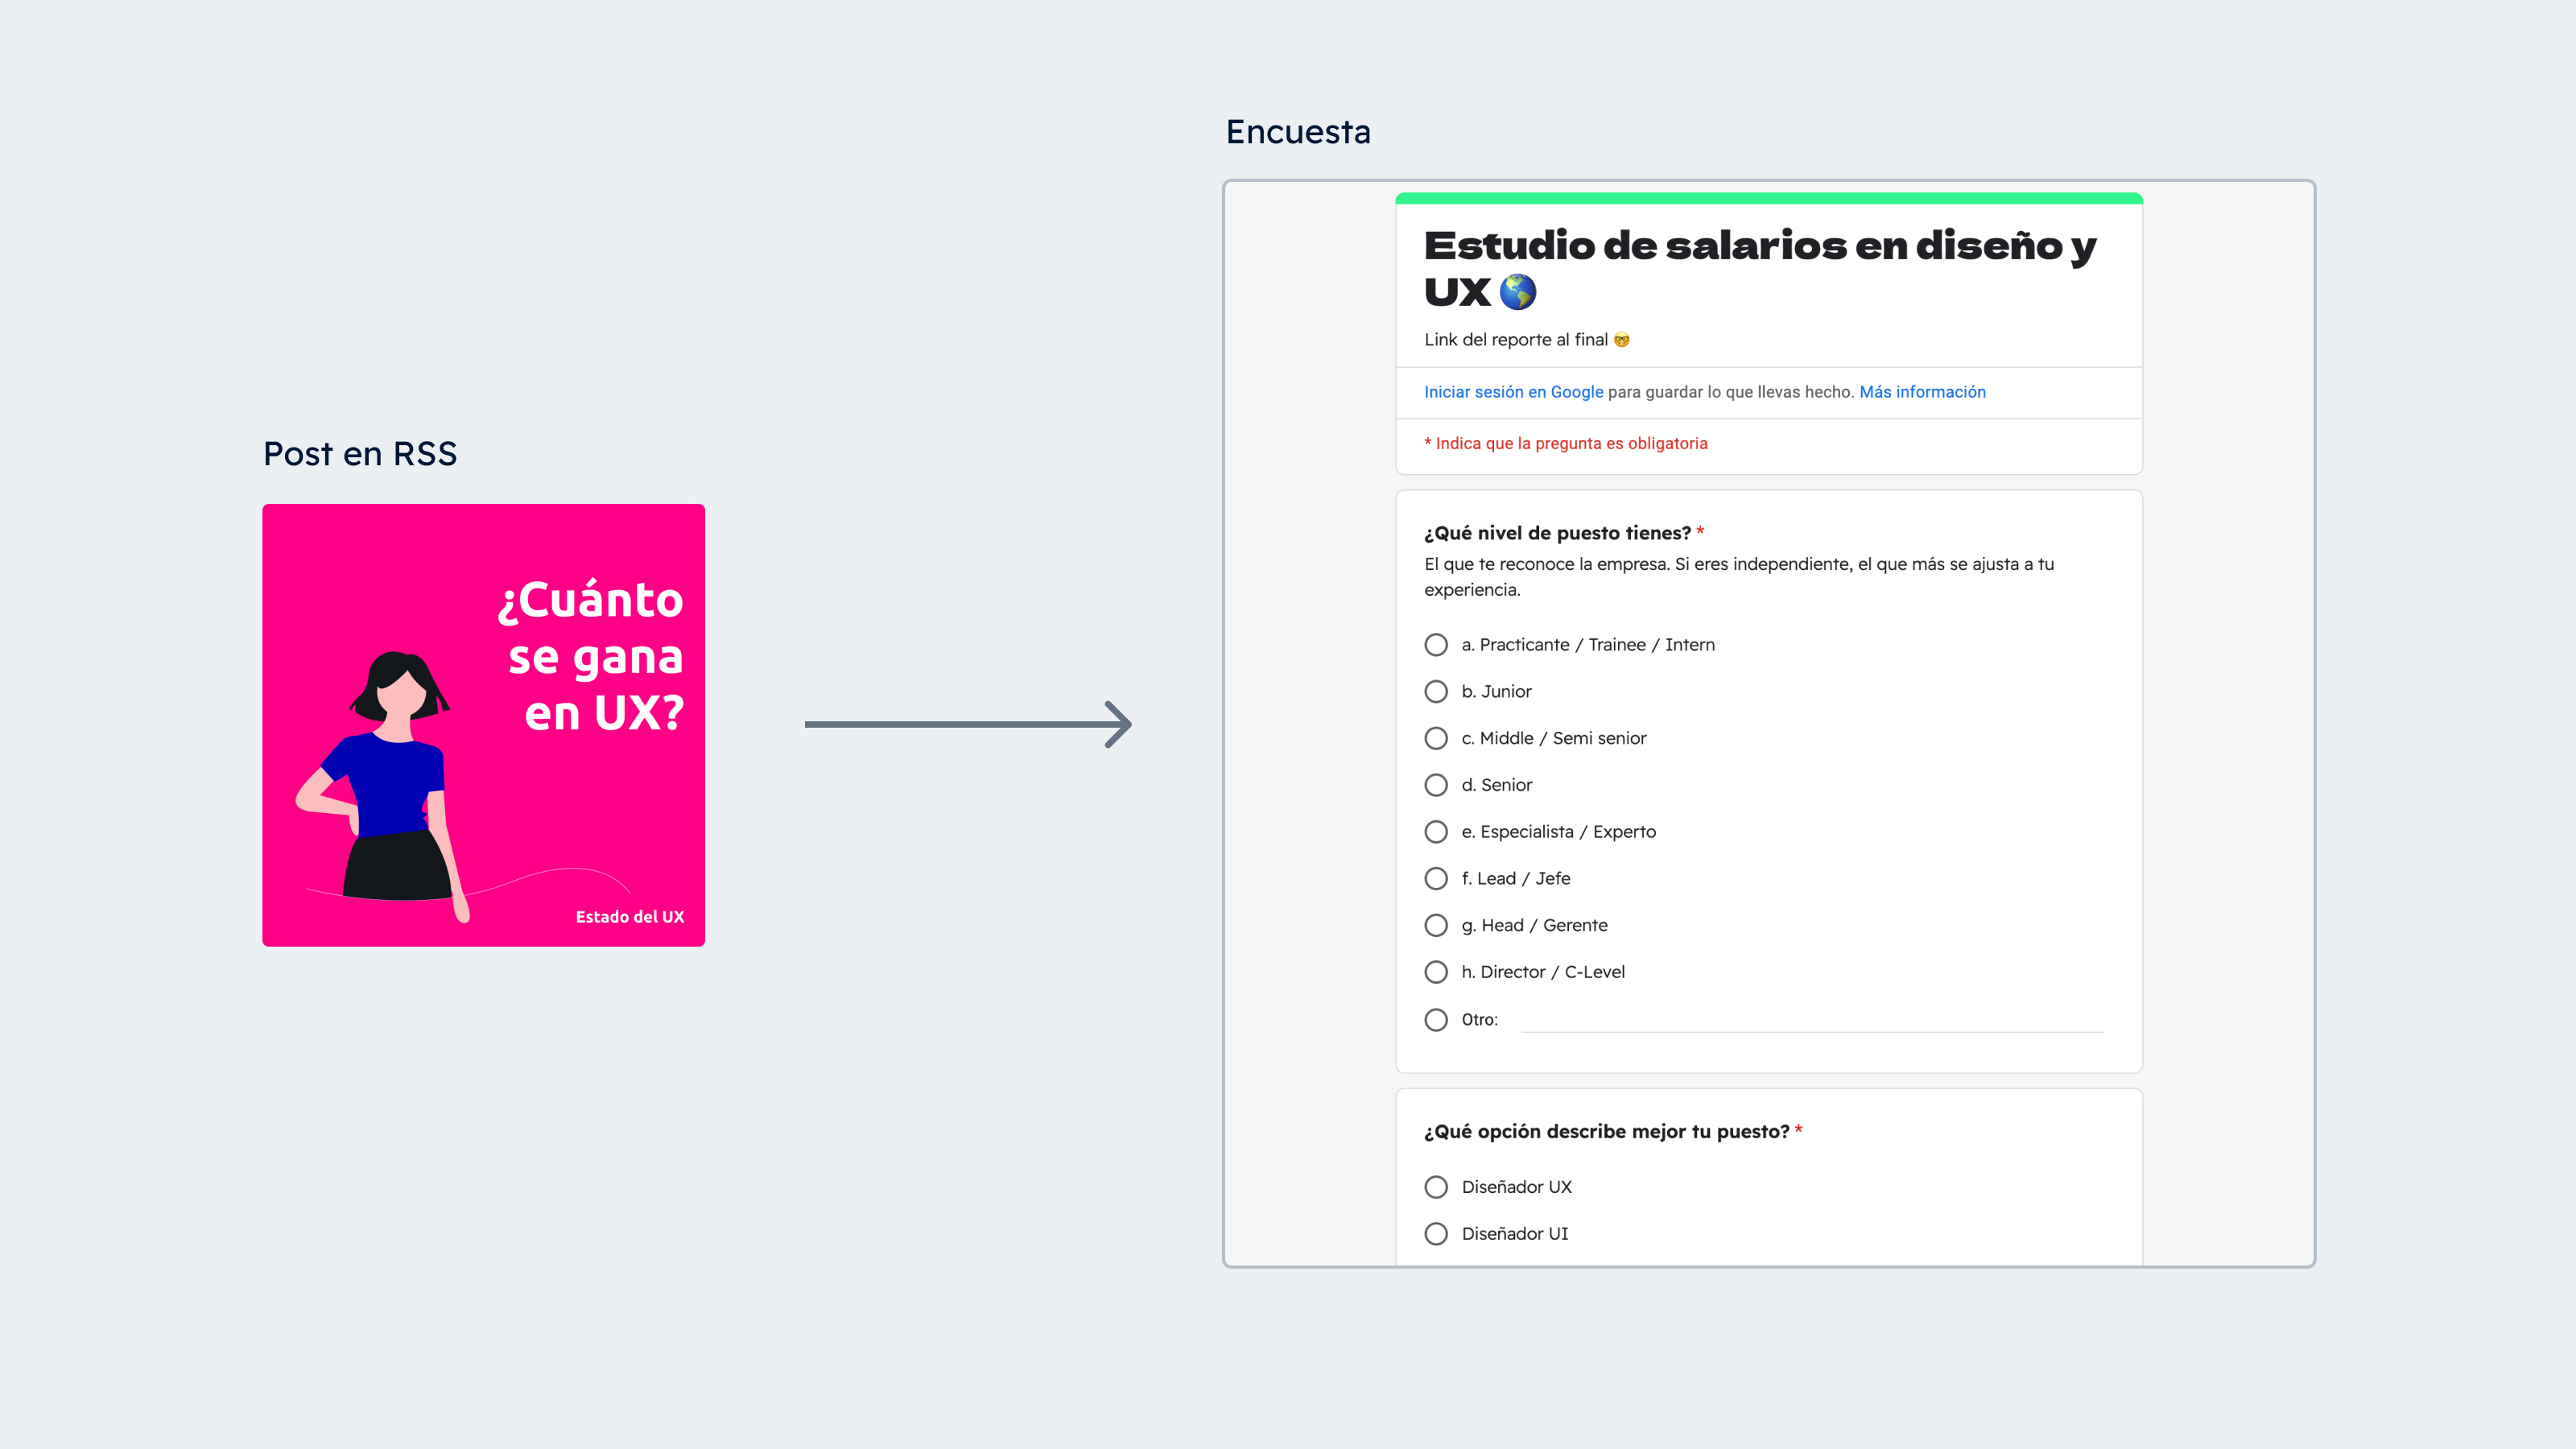
In October 2021, I launched 2 experiments: a salary survey and a form for recruiters to access the results. Both were distributed on social media.
Participants automatically received a basic report with simple visualizations.
- More than 50 designers participated in the first week, validating interest in this kind of information.
- Recruiters showed no interest in the reports.
Iteration
Finding what works with data
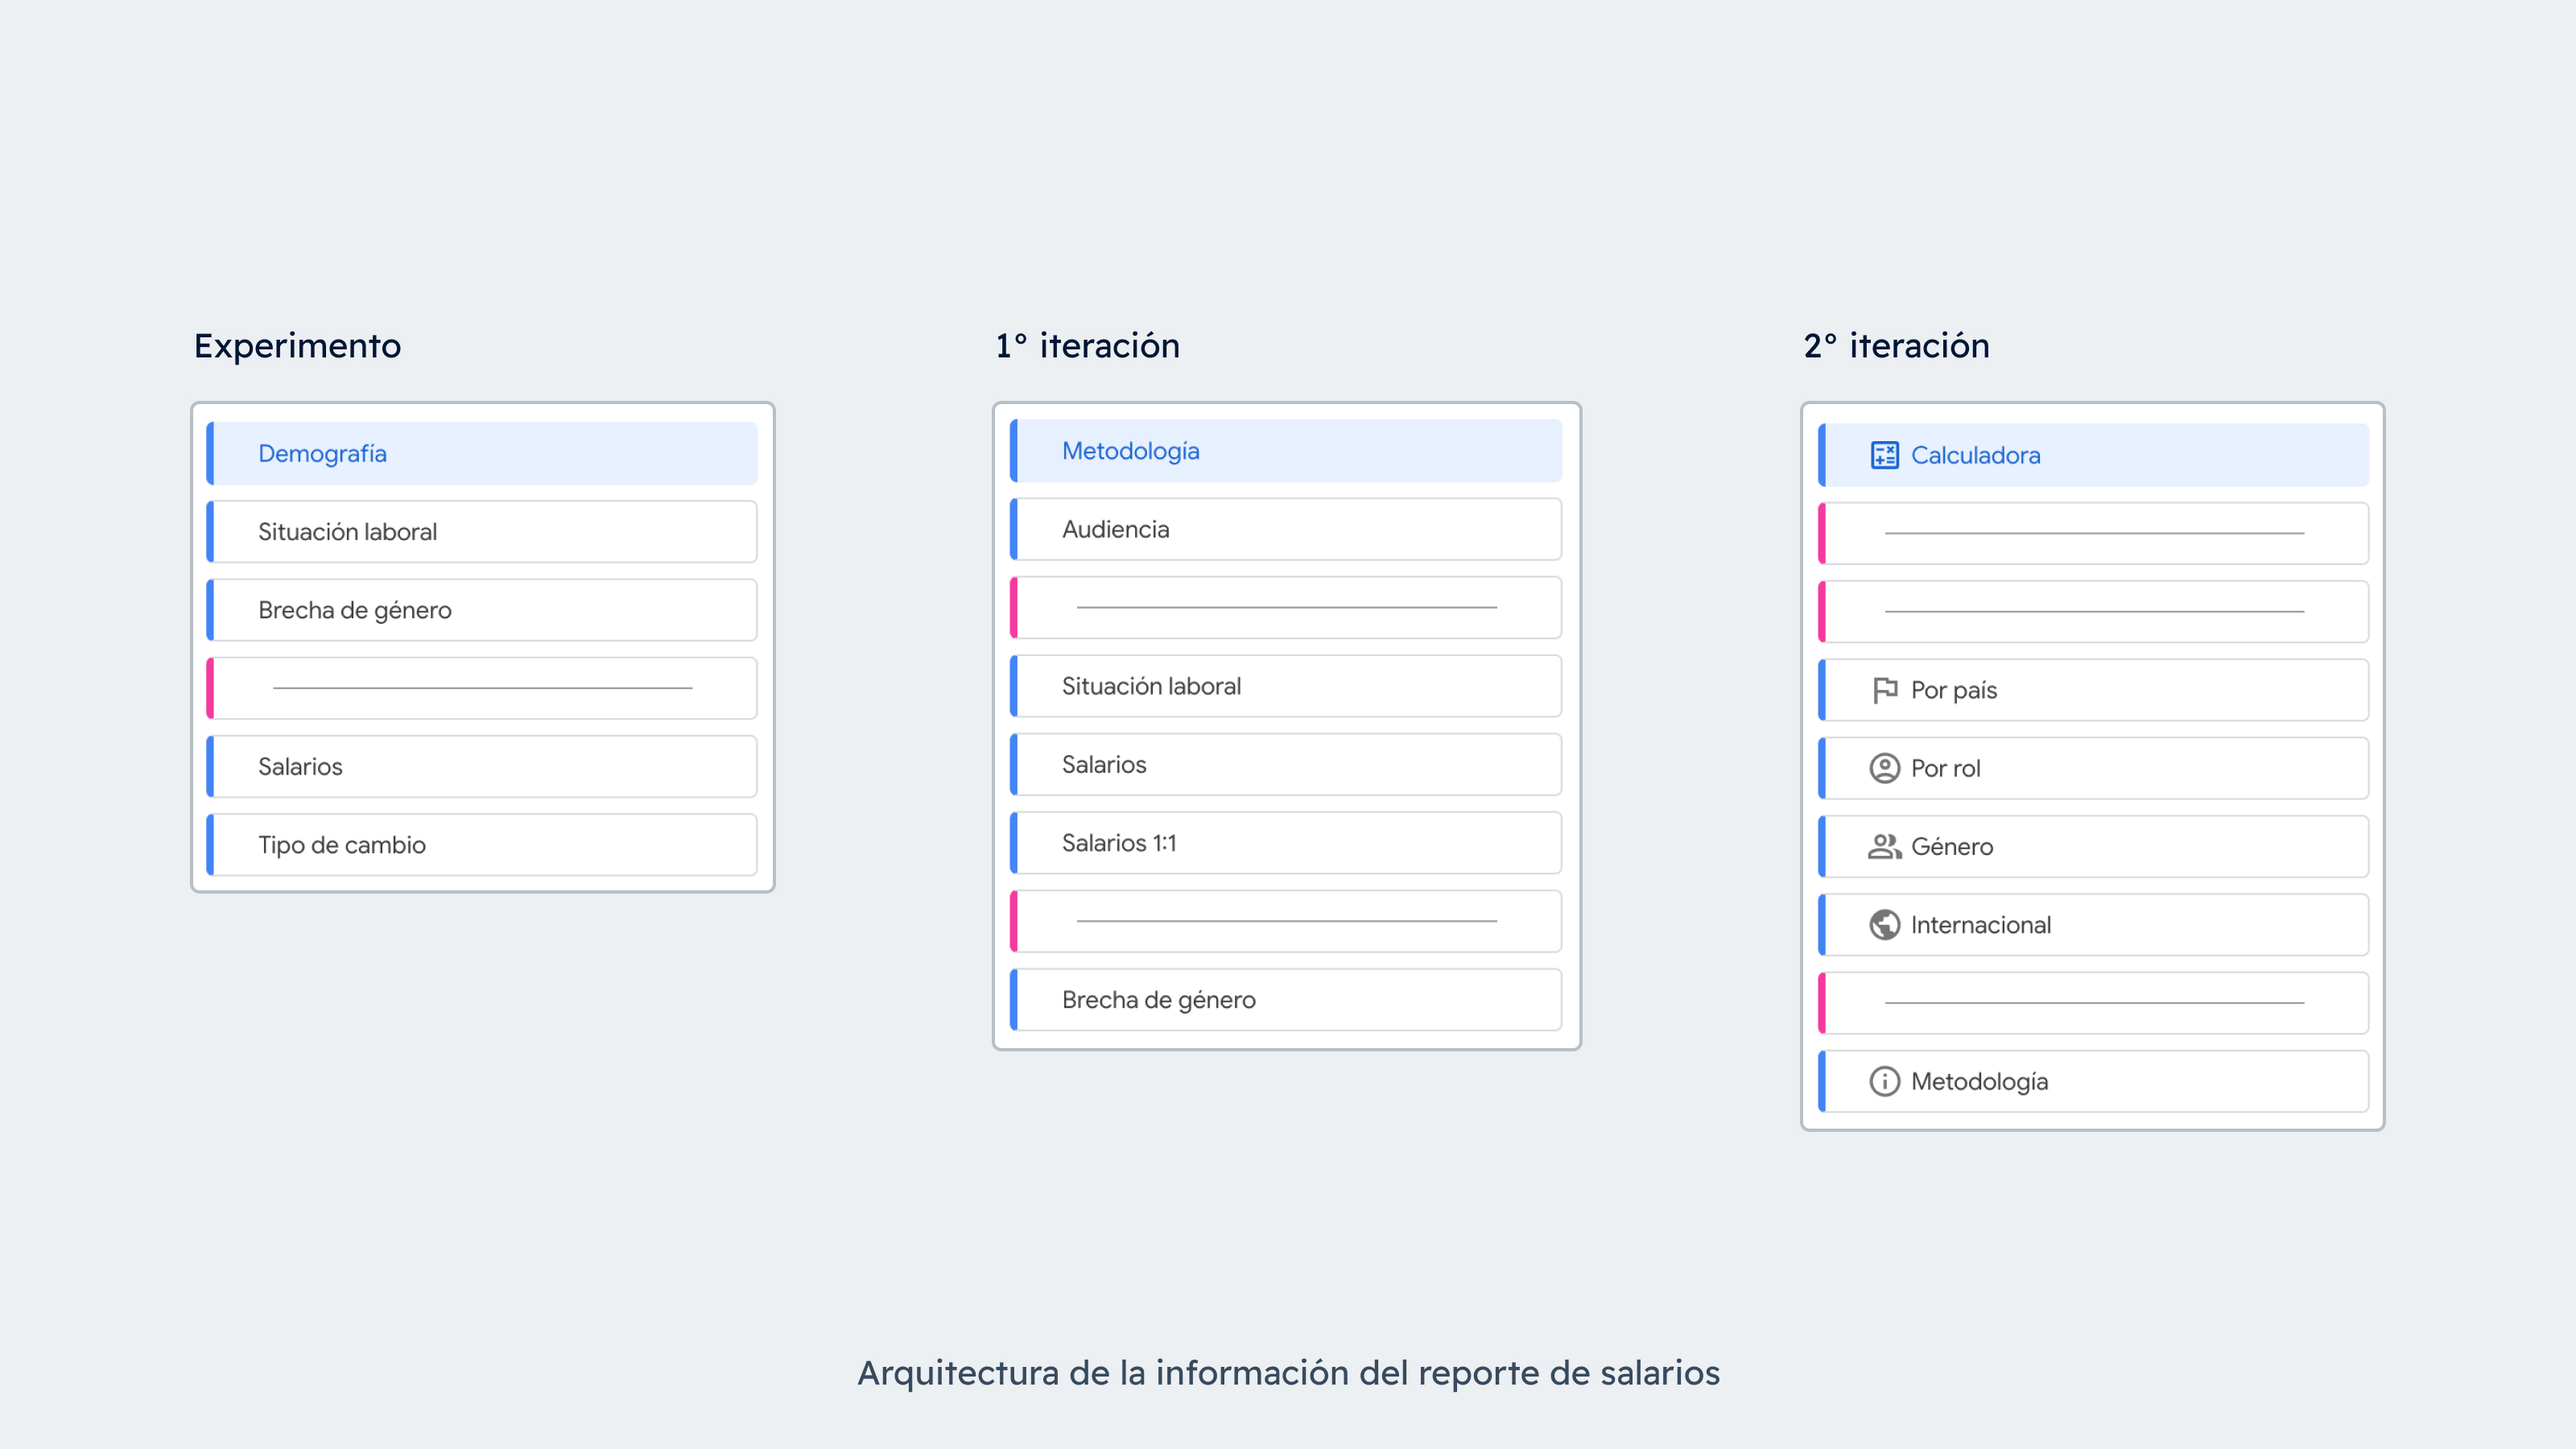
The salary study included multiple cross-referenced variables (country, experience, company type, gender, role, among others), which required a solid architecture to visualize them without overwhelming the reader.
To understand what generated the most interest, I implemented Google Analytics on the reports to analyze how users interacted with the data and iterate on the architecture.
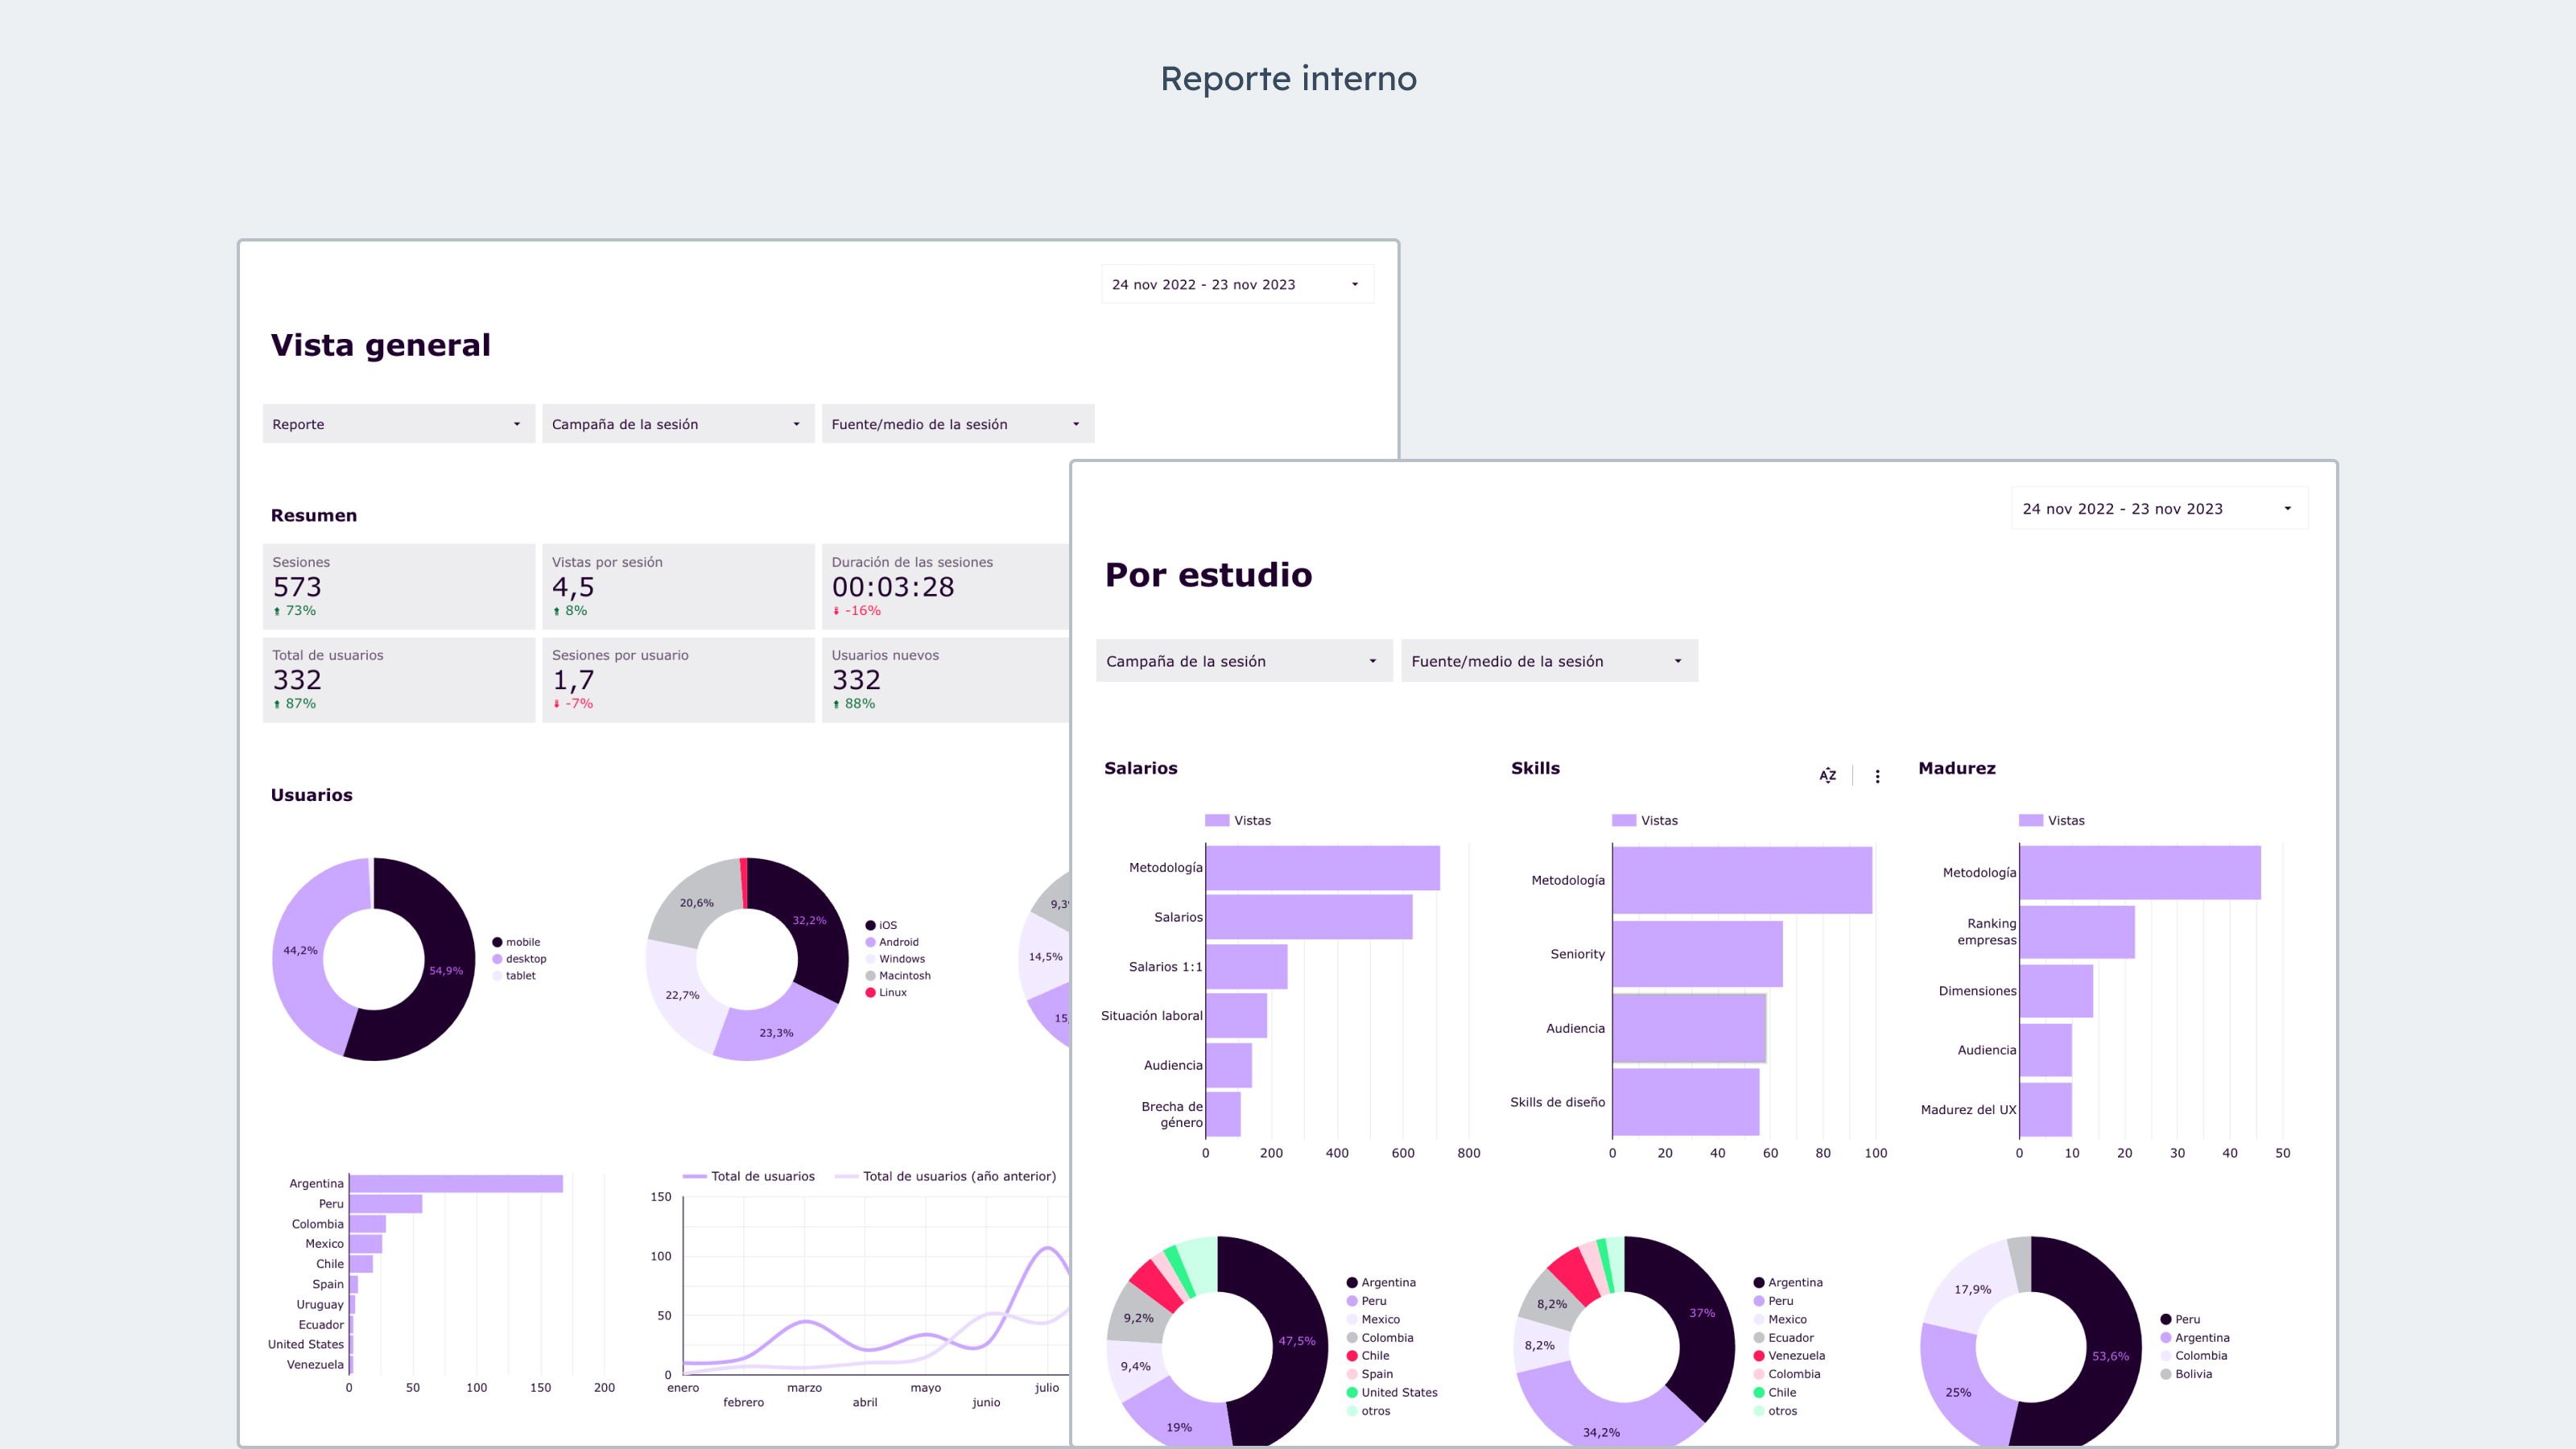
On the other hand, the skills and UX maturity studies demanded translating abstract concepts into models that were understandable for users and manageable for me.
One of the main challenges was the complexity of the data.
Automating to scale
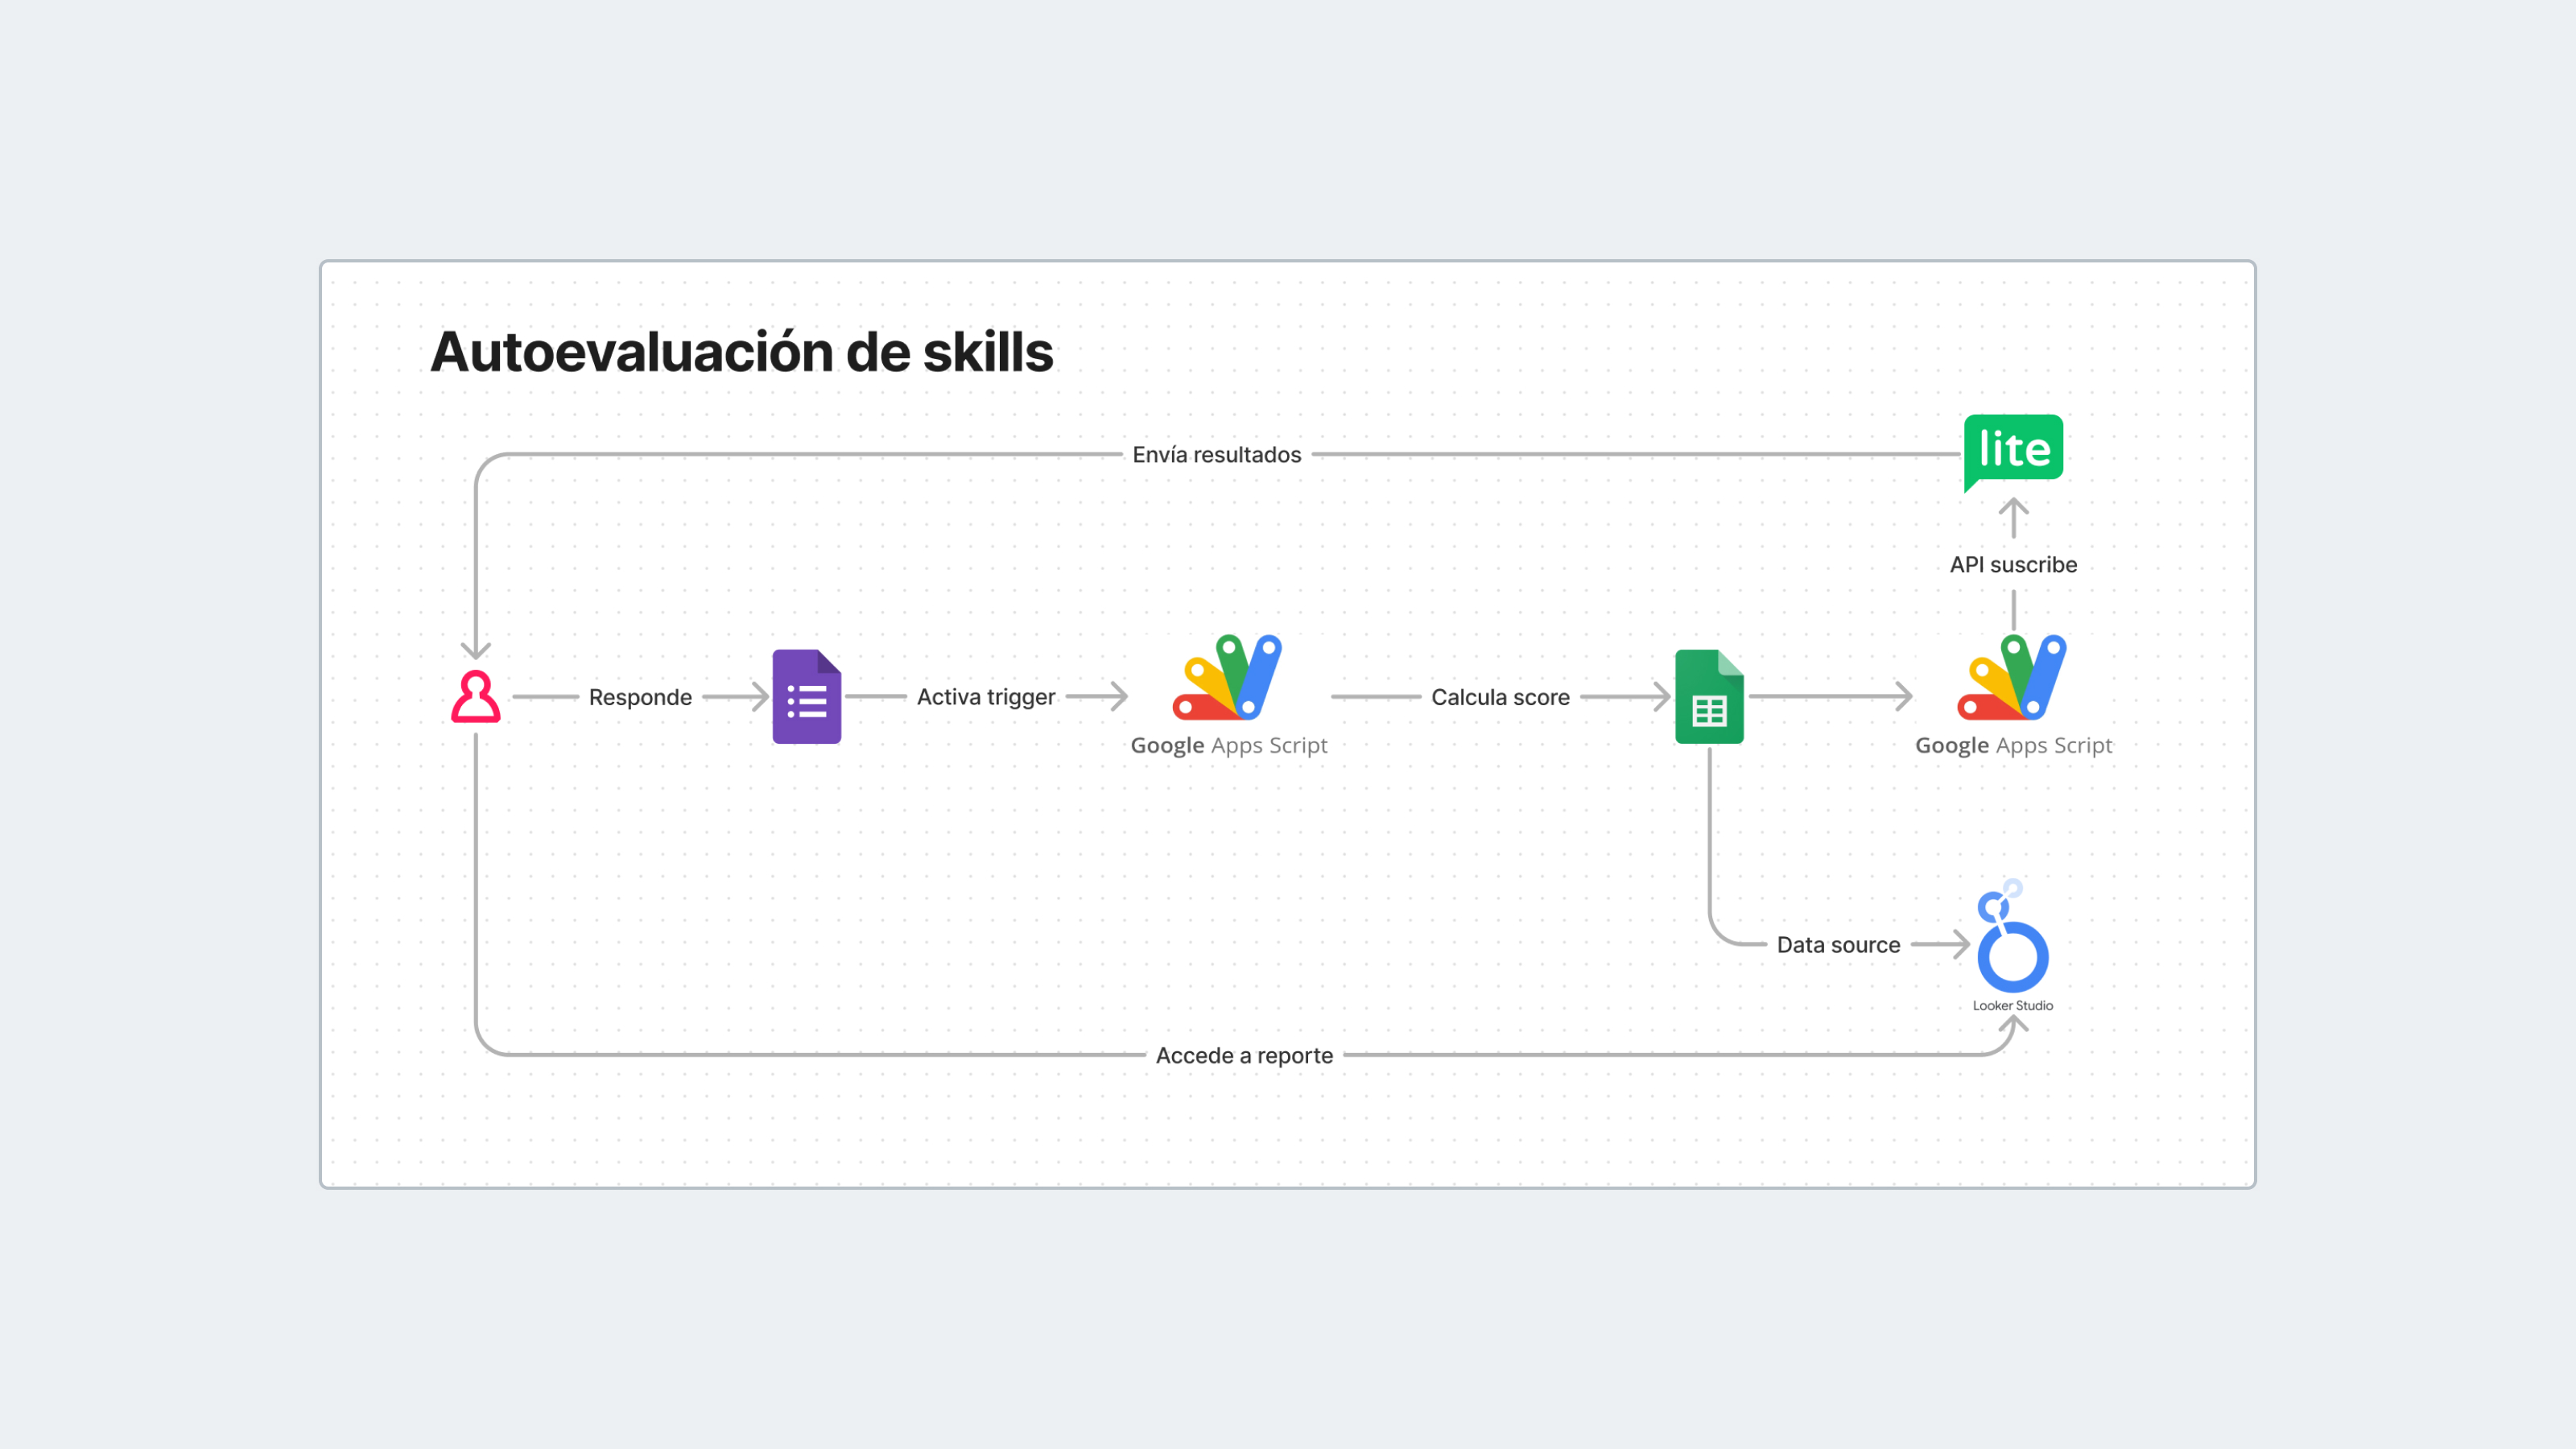
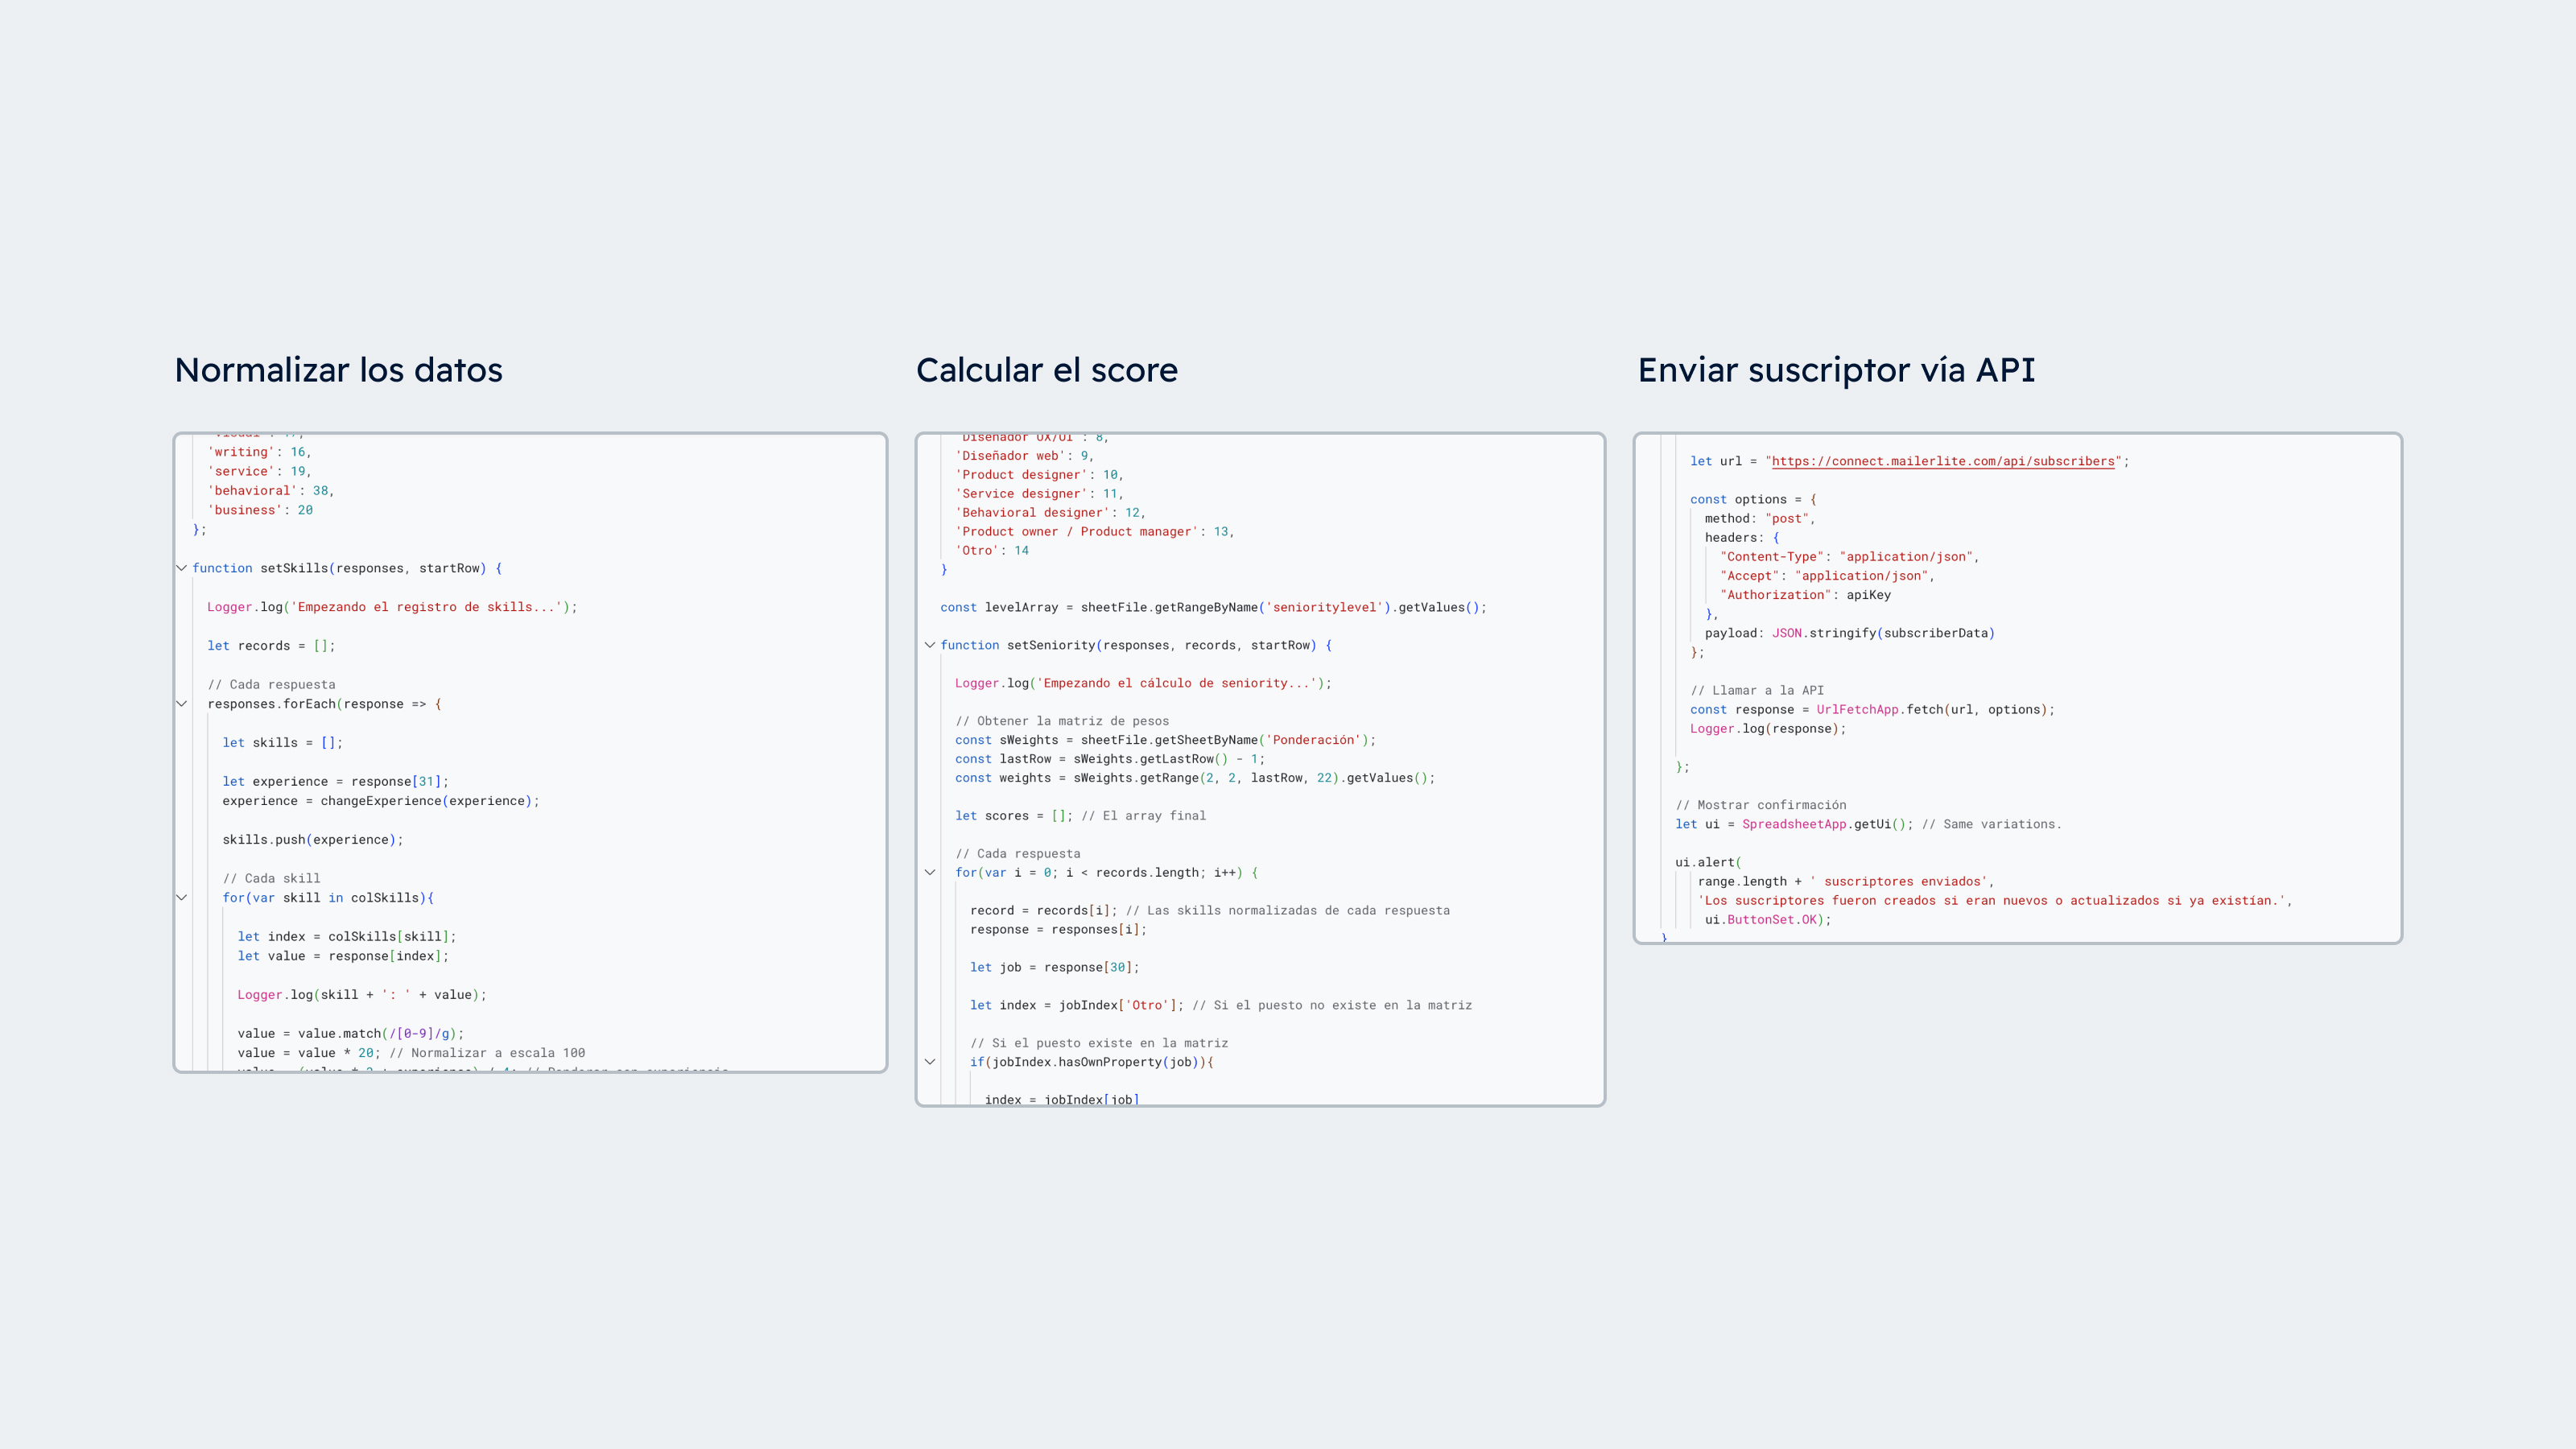
To sustain the project long-term while keeping quality high, I automated key processes using no-code and low-code tools:
Data collection and processing
Google Forms + Apps Script
Dynamic results visualization
Looker Studio
Custom communication flows
Google Apps Script + Mailerlite API
Content generation
ChatGPT + Claude
Impact and results
+5 years of data
This project not only helped me better understand the design landscape, but also contributed valuable data to the design community.
+4,000
responses collected across +20 countries
68%
annual growth in participants
1.6
studies answered per person on average
60%
of participants registered their email for future studies
The project has been shared organically by professionals at all levels across UX communities in Latin America.